


Why is Aluminum Cheaper than Copper I. The Gap in Resource Reserves
1.1 Aluminum Resource Reserves
Aluminum is the most abundant metallic element in the Earth’s crust. By mass, aluminum accounts for 8.1 percent of the crust, ranking fourth after iron (5.0 percent), calcium (3.6 percent), and sodium (2.8 percent).
Global bauxite reserves (the primary raw material for aluminum production) are estimated at approximately 30 billion tons. The major deposits are distributed in Guinea (25 percent), Australia (20 percent), Vietnam (12 percent), Brazil (9 percent), and Jamaica (7 percent).
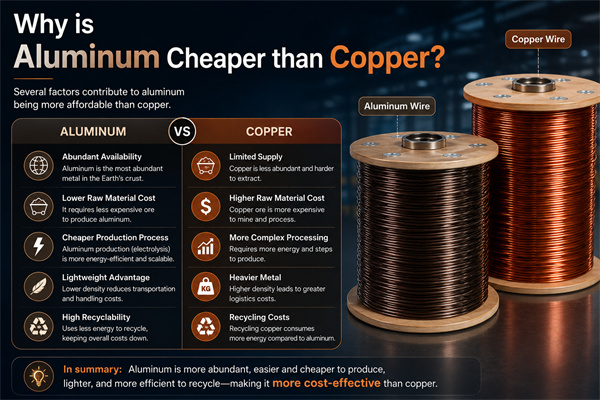
At current extraction rates, global bauxite reserves can supply over 100 years — the resource is extremely abundant.
1.2 Copper Resource Reserves
In contrast, copper accounts for only 0.0068 percent of the Earth’s crust — that is 1/1,200th of the aluminum content.
Global copper reserves are estimated at approximately 870 million tons (metal content). The major deposits are distributed in Chile (28 percent), Australia (11 percent), Peru (10 percent), Russia (7 percent), and Mexico (6 percent).
At current extraction rates, global copper reserves can supply only 40 to 50 years — a relatively scarce strategic resource.
1.3 Resource Reserve Comparison Table
The following table summarizes the comparison of aluminum and copper across three dimensions: resource reserves, mining years, and geographic distribution:
| Comparison Dimension | Aluminum (Aluminum) | Copper (Copper) |
|---|---|---|
| Crustal Abundance | 8.1% | 0.0068% |
| Global Proved Reserves | approx. 30 billion tons | approx. 870 million tons |
| Static Mine Life | 100+ years | 40 to 50 years |
| Concentration (Top 3 Countries) | 57% | 49% |
| Resource Scarcity | highly abundant | relatively scarce |
The difference in resource scarcity is the most fundamental reason aluminum is cheaper than copper.
II. Differences in Extraction Cost
2.1 Aluminum Extraction Process
Aluminum is extracted using the electrolytic method (Hall-Héroult process). From bauxite to metallic aluminum, the following steps are required: bauxite mining, Bayer process for alumina extraction, Hall-Héroult electrolytic reduction of alumina, casting of aluminum ingots, and processing of aluminum materials.
The core raw materials for electrolytic aluminum are alumina (Al₂O₃), cryolite (Na₃AlF₆), and carbon anodes. The electrolytic process consumes a large amount of electrical energy (approximately 13,000 to 15,000 kWh per ton of aluminum).
The extraction cost of alumina is approximately USD 300 to 500 per ton. The energy cost for electrolytic aluminum is approximately USD 1,500 to 2,000 per ton. The total extraction cost is approximately USD 1,800 to 2,500 per ton.
2.2 Copper Extraction Process
Copper is extracted primarily by pyrometallurgical smelting (80 percent) combined with hydrometallurgical processing (20 percent). From copper ore to metallic copper, the following steps are required: copper ore mining, flotation to obtain copper concentrate, pyrometallurgical smelting to obtain blister copper, electrolytic refining to obtain electrolytic copper, and processing of copper materials.
The core raw material for pyrometallurgical smelting is copper concentrate (containing 20 to 30 percent copper). The energy consumption of electrolytic refining is relatively low (approximately 1,000 to 1,500 kWh per ton of copper).
The mining cost of copper ore is approximately USD 3,000 to 5,000 per ton (including mining and beneficiation). The smelting and refining cost is approximately USD 1,500 to 2,500 per ton. The total extraction cost is approximately USD 4,500 to 7,500 per ton.
2.3 Extraction Cost Comparison
In terms of extraction cost, aluminum’s extraction cost is approximately USD 1,800 to 2,500 per ton, while copper’s extraction cost is approximately USD 4,500 to 7,500 per ton.
Copper’s extraction cost is 2 to 3 times that of aluminum. This is primarily due to the low grade of copper ore (typical copper ore grade is 0.5 to 1 percent, while bauxite grade can reach 30 to 60 percent).
The lower the ore grade, the more ore must be processed to obtain the same mass of metal — this is the core reason for the high cost of copper mining.
III. Differences in Physical Properties
3.1 Conductivity Difference
Aluminum has a conductivity of 61 percent IACS (International Annealed Copper Standard), while copper is 101 percent IACS — copper’s conductivity is 1.65 times that of aluminum.
This means that under the same resistance requirement, the cross-sectional area of an aluminum conductor must be increased by 1.65 times to achieve the same current carrying capacity as copper.
Although aluminum is slightly less conductive than copper, aluminum’s low density (2.70 g/cm³ versus copper’s 8.96 g/cm³) gives it a significant advantage in weight-sensitive applications such as EV and aviation.
3.2 Weight Advantage
The density of aluminum is approximately 30 percent that of copper — at the same volume, aluminum weighs only 30 percent of copper.
In applications such as cables, winding wire, and transformer windings, the lightweight advantage of aluminum can reduce transportation costs, simplify installation processes, and improve energy efficiency.
3.3 Differences in Processability
Copper has better ductility than aluminum — copper’s elongation can reach 30 to 40 percent, while aluminum’s elongation is only 8 to 15 percent (annealed condition).
This means copper is easier for fine wire drawing, complex shape processing, and precision winding. Aluminum processing requires more refined process control.
However, in applications involving large cross-section conductors (such as power cables and busbars), the difference in processability between aluminum and copper is small.
3.4 Differences in Corrosion
Resistance
Copper forms a green patina (basic copper carbonate) in the atmosphere — this oxide layer is loose, easily peeled off, and provides limited protection to the underlying metal.
Aluminum forms a dense aluminum oxide film (Al₂O₃) in the atmosphere — this oxide layer is dense, stable, and self-healing, providing good protection to the underlying metal.
In most atmospheric environments, aluminum’s corrosion resistance is superior to copper — this is why aluminum has an advantage in outdoor applications such as overhead lines and transformer housings.
IV. Market Supply and Demand
4.1 Global Production Comparison
In 2024, global electrolytic aluminum production was approximately 70 million tons, and global refined copper production was approximately 27 million tons.
Aluminum’s production is 2.6 times that of copper — this reflects the abundance of aluminum resources and the wide range of applications.
The main applications of aluminum include: transportation (25 percent), construction (25 percent), packaging (15 percent), electrical (10 percent), mechanical equipment (10 percent), and others (15 percent).
The main applications of copper include: electrical and electronics (70 percent), construction (15 percent), transportation (8 percent), mechanical equipment (5 percent), and others (2 percent).
4.2 Supply Elasticity Differences
Aluminum has a relatively large supply elasticity — bauxite reserves are abundant, electrolytic aluminum capacity can be expanded quickly, and price increases stimulate new capacity coming online.
Copper has a relatively small supply elasticity — copper ore reserves are limited, new mine development takes a long time (5 to 10 years), and declining ore grades cause mining costs to rise.
When market demand increases, the rise in copper price is usually much greater than that of aluminum — this is the fundamental reason why the copper-to-aluminum price ratio is maintained at 3 to 4 times over the long term.
4.3 Historical Price Trends
The following table summarizes the annual averages of LME copper and aluminum prices from 2020 to 2025:
| Year | LME Copper (USD/ton) | LME Aluminum (USD/ton) | Cu/Al Ratio |
|---|---|---|---|
| 2020 | 6,180 | 1,700 | 3.64 |
| 2021 | 9,320 | 2,480 | 3.76 |
| 2022 | 8,820 | 2,710 | 3.26 |
| 2023 | 8,490 | 2,250 | 3.77 |
| 2024 | 9,200 | 2,400 | 3.83 |
| 2025 | 9,500 | 2,550 | 3.73 |
From the historical data, the copper-to-aluminum price ratio is maintained between 3 and 4 times over the long term. This ratio is the result of the combined effects of aluminum resource abundance, extraction cost, and market supply and demand.
V. Strategic and Geopolitical Factors
5.1 Resource Geopolitical Risks
Copper resources are highly concentrated in Latin American countries such as Chile and Peru — this brings significant geopolitical risks.
In 2024, events such as Chilean copper mine strikes, Peruvian community protests, and the First Quantum mining dispute in Panama pushed up copper prices multiple times.
Aluminum resources are relatively distributed (Guinea, Australia, Brazil, Vietnam, India, etc.) — the geopolitical risk is lower.
5.2 Recycling and Sustainability
The recycling rate of aluminum is significantly higher than that of copper. The global aluminum recycling rate is approximately 70 percent (each ton of recycled aluminum saves 95 percent of energy).
The recycling rate of copper is approximately 55 percent. The grade of copper ore continues to decline (from 1.0 percent in 2000 to 0.5 percent in 2024), leading to continuously rising mining costs for new ores.
In the next 10 to 20 years, aluminum’s advantages in sustainability will further expand.
5.3 Policy and Carbon Emissions
The EU CBAM (Carbon Border Adjustment Mechanism) will be fully implemented in 2026, and both aluminum and copper will be included in the carbon tariff scope.
The carbon footprint of aluminum is approximately 8 to 12 tons CO₂ per ton (electrolytic aluminum plus alumina), while the carbon footprint of copper is approximately 3 to 5 tons CO₂ per ton.
Although aluminum’s carbon emissions are higher, the lightweight benefits of aluminum can significantly reduce the full lifecycle carbon emissions of end products — this is particularly important in the EV, aviation, and renewable energy sectors.
VI. Conclusion
Aluminum is cheaper than copper as a result of the combined effects of five dimensions: resource reserves, extraction cost, physical properties, market supply and demand, and strategic factors.
The most fundamental reason is the difference in resource scarcity — aluminum’s crustal abundance is 1,200 times that of copper, reserves are 35 times that of copper, and mining life is 2.5 times that of copper.
Resource scarcity determines extraction cost — copper’s extraction cost is 2 to 3 times that of aluminum, with low copper ore grade and large processing volume.
The difference in market supply and demand further amplifies the price gap — copper’s supply elasticity is much smaller than aluminum’s, and copper prices are more sensitive to market fluctuations.
For electrical engineers, a trade-off needs to be made between conductivity, weight, and cost. Copper is suitable for applications with small size, high conductivity, and precision winding; aluminum is suitable for applications with large size, lightweight, and cost sensitivity.
For procurement personnel, understanding the underlying logic of aluminum being cheaper helps with material selection decisions — it is not simply “aluminum is cheaper so choose aluminum,” but a comprehensive consideration of performance, weight, cost, and application scenarios.
For industry observers, in the next 10 to 20 years, the decline in copper ore grade, copper resource geopolitical risks, and aluminum recycling rate advantages will further drive the engineering application of aluminum replacing copper — this is an important trend in the winding wire, transformer, and cable industries.